Sidebar
Table of Contents
23.3.9 Bézier curve basics
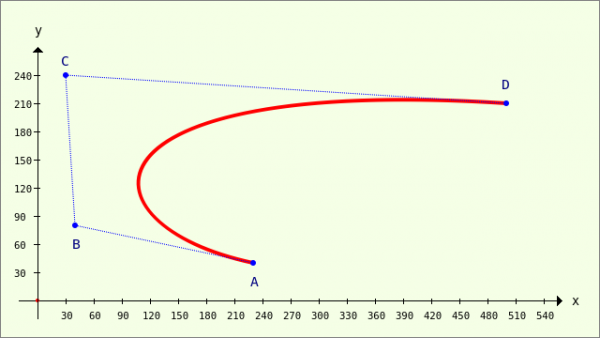
The CurveTo method of the Paint class uses third-degree Bézier curves, which are determined by 4 points, to draw → Chapter 23.3.5.3 'Bézier curves'. Two points (A and D) determine the start and end points of the curve, whose curvature behaviour is determined by the position of all 4 points A, B, C and D → Figure 23.3.8.1. Points B and C are called support points.
Figure 23.3.9.1: Bézier curve of the 3rd degree (4 points)
In this chapter, an attempt is made to develop an analytical description of a 2nd order Bézier curve from the geometric definition of a 2nd order Bézier curve - for which there is no method in the Paint class. This is linked to the expectation that you will better understand the work with 3rd degree Bézier curves because the theory is based on similar approaches.
Using the explicit parameter equations obtained and the methods of the Paint class, some 2nd degree Bézier curves will be drawn.
23.3.9.1 Geometric definition of a 2nd degree Bézier curve
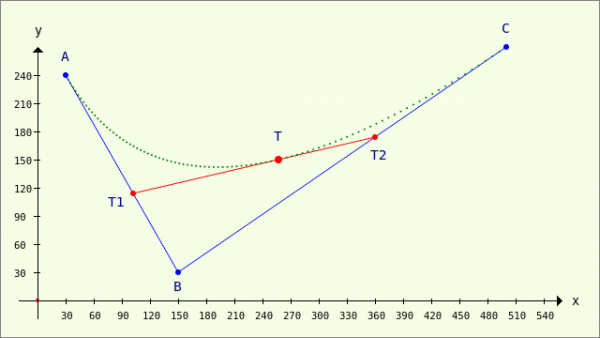
Given three (different) points A, B and C in a (coordinate) plane with a (normalised) vector basis. The points A, B and C are connected in the manner shown. The two division points T1 and T2 exist on the connecting lines AB and BC, on whose connecting line T1T2 the point T lies:
Figure 23.3.9.1.1: Bézier curve - 2nd degree definition (3 points)
The following definition applies to the three division points T1, T2 and T, which determines their position on the connecting lines:
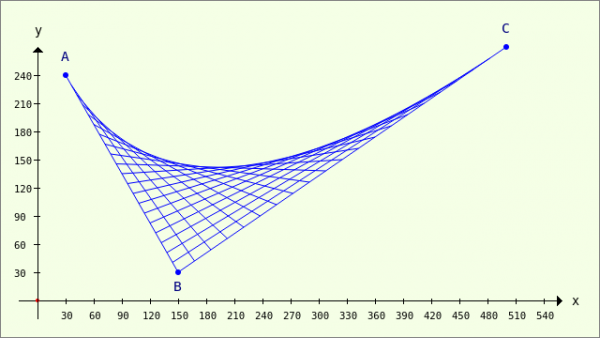
For each real parameter value p from the interval [0|1], T is a so-called Bézier point. The set of all points T=T(p) results in the Bézier curve AC from A to C with T(0) = A and T(1) = C. The dotted green line consists of selected points of the Bézier curve AC. If you draw the connecting lines of the points TiTj for selected parameters p, this image is created:
Figure 23.3.9.1.2: Representation of connecting lines TiTj
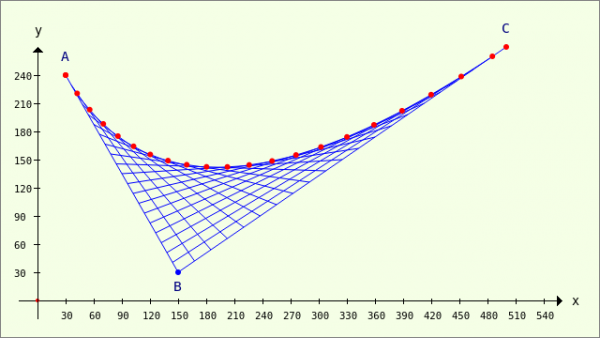
You can already 'see' the envelope curve of all connecting lines of the points TiTj very clearly. The impression is further emphasised if the defined Bézier points T on the connecting lines are also drawn in red:
Figure 23.3.9.1.3: Bézier points
23.3.9.2 Analytical description of a 2nd degree Bézier curve
We are looking for an analytical description for the coordinates of the Bézier points T = T(p) for each parameter value p from the interval 0 ≤ p ≤ 1 on the Bézier curve from A to C:
Equations 4 and 5 are obtained from the two vector equations 1 and 2 by substituting equations 1 and 2 into 3:
Equation 5 gives rise to the two (explicit) parameter equations 6 and 7 for calculating the x and y coordinates of a Bézier point of the quadratic Bézier curve (2nd degree) between points A and C, whose curvature behaviour is defined by the position of point B:
23.3.9.3 Examples of 2nd degree Bézier curves
Example 1
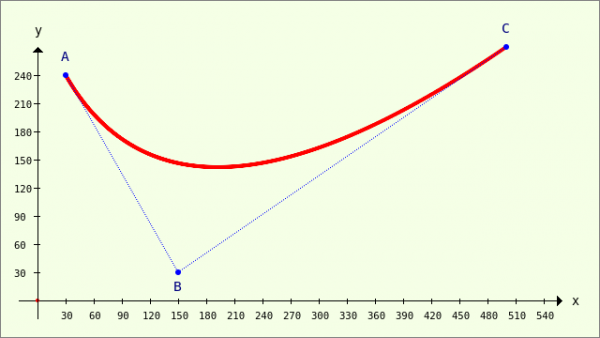
The Bézier curve AB with support point B is drawn using equations 6 and 7 and methods of the Paint class:
Figure 23.3.9.3.1: Bézier curve AC - B(150|30)
In the following source code, the points A, B and C are declared using global variables of data type PointF and the two equations 6 and 7 are implemented as functions:
[1] Public A As PointF
[2] Public B As PointF
[3] Public C As PointF
[4]
[5] Public Sub Form_Open()
[6]   …
[7]   A = New PointF
[8]   A.x = 30
[9]   A.y = 240
[10]   B = New PointF(150, 30) '-- Alternative specification of the coordinates of a point
[11]   C = New PointF(500, 270)
[12]   …
[13] End
[14]
[15] Public Function BézierX(p As Float, AX As Float, BX As Float, CX As Float) As Float
[16] ' Analytical description x(p) of a 2nd degree Bézier curve (3 points)
[17]   Return (1 - p) * (1 - p) * AX + 2 * (1 - p) * p * BX + p * p * CX
[18] End
[19]
[20] Public Function BézierY(p As Float, AY As Float, BY As Float, CY As Float) As Float
[21] ' Analytical description y(p) of a 2nd degree Bézier curve (3 points)
[22]   Return (1 - p) * (1 - p) * AY + 2 * (1 - p) * p * BY + p * p * CY
[23] End
The procedure PaintScriptBézier3Points() for drawing a 2nd degree Bézier curve uses the procedures that were already used in the project examples in → Chapter 23.3.3:
[1] Public Sub PaintScriptBezier3Points()
[2]   Dim k As Integer
[3]   Dim p As Float
[4]   Dim vP As Vector
[5]
[6]   GenerateNewPicture()
[7]   SetPictureBorder()
[8]   Paint.Begin(hPicture)
[9]     Paint.Translate(xTranslate, yTranslate)
[10]     Paint.Scale(xScale, yScale) ' +y ▲
[11]     DrawCoordinateSystem()
[12]
[13]   ' PARABLE PIECE
[14]     Paint.Brush = Paint.Color(Color.Red)
[15]     Paint.Brush = Paint.Color(Color.Red)
[16]     For k = 0 To (C.x - A.x)
[17]         p = k / 470
[18]         Paint.Arc(BézierX(p, A.x, B.x, C.x), BézierY(p, A.y, B.y, C.y), 2)
[19]     Next
[20]     Paint.Fill()
[21]
[22]   ' Connecting lines A-B-C
[23]     Paint.Brush = Paint.Color(Color.Blue)
[24]     Paint.LineWidth = 1
[25]     Paint.Dash = [1, 1]
[26]     Paint.MoveTo(A.x, A.y)
[27]     Paint.LineTo(B.x, B.y)
[28]     Paint.LineTo(C.x, C.y)
[29]     Paint.Stroke()
[30]     Paint.Dash = Null
[31]
[32]   ' Points A, B and C
[33]     Paint.Arc(A.x, A.y, 3)
[34]     Paint.Arc(B.x, B.y, 3)
[35]     Paint.Arc(C.x, C.y, 3)
[36]     Paint.Fill()
[37]
[38]   ' TEXT
[39]     Paint.NewPath
[40]     Paint.Scale(1, -1) ' +y ▼
[41]       Paint.Font = Font["Monospace, 11"]
[42]       Paint.Brush = Paint.Color(Color.DarkBlue)
[43]       Paint.DrawText("A", 25, -255)
[44]       Paint.DrawText("B", 145, -10)
[45]       Paint.DrawText("C", 495, -285)
[46]     Paint.Scale(1, -1) ' +y ▲
[47]   Paint.End
[48]
[49] End
Comment:
- The Bézier curve is drawn as a sequence of points in lines 15 to 20.
- The two functions BézierX(..) and BézierY(..) are used to calculate the coordinates Tx and Ty of each Bézier point T = T(p) in the interval 0 ≤ p ≤ 1 (T(0) = A and T(1) = C).
- The parameter interval of 0 ≤ p ≤ 1 is mapped to the interval 0 ≤ x ≤ (C.x-A.x) in lines 16 and 17 for drawing the Bézier points.
- In line 18, a Bézier point T(p) with the coordinates Tx and Ty is drawn as a circle with a very small radius.
- The connecting lines AB and BC as well as the points A, B and C are drawn in the further instructions from line 22. Finally, the three points are labelled - but without specifying coordinates.
Example 2
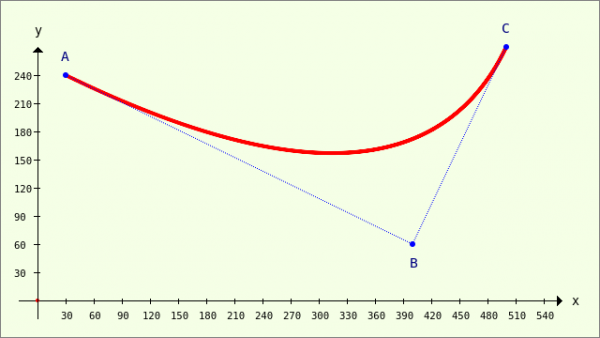
Figure 23.3.9.3.2: Bézier curve - B(400|60)
In the second example, the coordinates of support point B are changed. The coordinates of the start point A and the end point C remain unchanged compared to example 1. The influence of point B on the course of the Bézier curve can be seen very clearly. In the 'BézierExkurs' project, you can change the coordinates of B within wide limits to see the effect of the change immediately.

