Sidebar
23.3.4.1 Project 1 - Drawing with Paint
Project 1 shows you various ways of drawing different shapes and text using methods of the Paint class. In all examples, a Picture is used as the drawing area, whereby the terms Picture and Picture object are used synonymously here. The advantages of this approach have already been presented in → Chapter 23.3.3 Drawing with Paint. In addition to the drawn picture, the source text used is presented and briefly commented on if necessary. These variables apply globally in the project:
Public hFile As File
Public hPicture As Picture
Public sPicturePath As String = Application.Path &/ "Pictures"
Public xTranslate As Float = 40  '-- Shift coordinate system x-axis
Public yTranslate As Float = 320 '-- Shift coordinate system y-axis
Public xScale As Float = +1      '-- Scaling x-direction
Public yScale As Float = -1      '-- Scaling y-direction → +y ▲
These procedures apply to almost all examples:
Public Sub GenerateNewPicture()
  hPicture = New Picture(daCanvas.Width, daCanvas.Height, True) '-- Create a new Picture object
  hPicture.Fill(&H00F5FFE6&) '-- Option: Set background colour for the picture --> light green
End
Public Sub SetPictureBorder()
  Paint.Begin(hPicture)
    Paint.LineWidth = 2 '-- Thin, grey image border
    Paint.Brush = Paint.Color(Color.Gray)
    Paint.Rectangle(0, 0, daCanvas.Width, daCanvas.Height) '-- 640, 360
    Paint.Stroke()
  Paint.End()
End
Public Sub daCanvas_Draw()
  Paint.Begin(daCanvas)
    If hPicture Then Paint.DrawPicture(hPicture, 0, 0) '-- The picture is drawn in a DrawingArea
  Paint.End
End
The last procedure is used to display the picture - which only exists in memory.
The outsourcing of source code to individual procedures also answers the question: Can individual (partial) drawings be outsourced to procedures with a clear YES. The drawing area used is known between Paint.Begin(Device) and Paint.End() and every Paint call affects this drawing area. It is even advantageous to store (partial) drawings in procedures, as these procedures can be called later, for example to draw coordinate axes if required. This procedure is supported by the option of nesting individual Paint.Begin(Device) and Paint.End() calls. Including the SetPictureBorder() procedure in each example utilises this nesting.
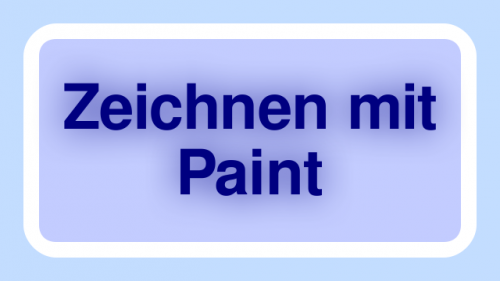
Example 1 - Drawing text
Figure 23.3.4.1.1: Drawn text
You can use plain text or rich text. In the first example, the use of RichText is presented as an alternative.
Source text:
[1] Public Sub PaintScriptText()
[2]   Dim textDimension As RectF
[3]   Dim sText1, sText2, sText As String
[4]   Dim X, Y, W, H As Float
[5]
[6]   hPicture = New Picture(daCanvas.Width, daCanvas.Height, True)
[7]   hPicture.Fill(&H00C3DDFF&) '-- light blue
[8]
[9]   Paint.Begin(hPicture)
[10] '-- Original coordinate system → +y-direction downwards!
[11]     Paint.Brush = Paint.Color(&C3CCFF)
[12]     Paint.Rectangle(40, 40, 560, 280, 32)
[13]     Paint.Fill(True)
[14]     Paint.Brush = Paint.Color(Color.White)
[15]     Paint.LineWidth = 20
[16]     Paint.Stroke()
[17]
[18]     Paint.Font.Name = "FreeSans"
[19]     Paint.Font.Size = 60
[20]     Paint.Font.Bold = True
[21] '-- Paint.Font = Font["FreeSans, 60, bold"] ' -- Compact font description
[22]
[23]     sText1 = ("Drawing with")
[24]     sText2 = ("Paint")
[25]
[26] '-- Text 1
[27]     textDimension = Paint.TextSize(sText1)
[28]     X = daCanvas.W / 2 - textDimension.W / 2 '-- zentriert
[29]     Y = 85
[30]     W = textDimension.W
[31]     H = textDimension.H
[32]     Paint.Brush = Paint.Color(Color.DarkBlue)
[33]     Paint.DrawTextShadow((sText1), X, Y, W, H,, 50, 0.8) '-- Alignment ,, is not used
[34]     Paint.Brush = Paint.Color(Color.DarkBlue)
[35]     Paint.DrawText((sText1), X, Y, W, H)
[36]
[37] '-- Text 2
[38]     textDimension = Paint.TextSize(sText2)
[39]     X = daCanvas.W / 2 - textDimension.W / 2
[40]     Y = 85 + Paint.TextSize(sText1).H - 20
[41]     W = textDimension.W
[42]     H = textDimension.H
[43]     Paint.Brush = Paint.Color(Color.DarkBlue)
[44]     Paint.DrawTextShadow((sText2), X, Y, W, H,, 50, 0.8)
[45]     Paint.Brush = Paint.Color(Color.DarkBlue)
[46]     Paint.DrawText((sText2), X, Y, W, H)
[47]
[48] '-- Alternative with RichText and lots of trial and error - until everything fits
[49] '-- Paint.Brush = Paint.Color(Color.Blue)
[50] '-- Paint.DrawRichTextShadow(("Drawing with Paint"), 0, 0, 640, 340, Align.Center, 50, 0.8)
[51] '-- Paint.Brush = Paint.Color(Color.DarkBlue)
[52] '-- Paint.DrawRichText(("Drawing with Paint"), 0, 0, 640, 340, Align.Center)
[53]
[54]   Paint.End()
[55]
[56] End
Comment:
- First, a Picture object is created in lines 6 and 7 and its background colour is set to light blue. Then a rectangle with rounded 'corners' is drawn in a different shade of blue and this is then given a thick white border.
- Font properties are assigned individually in lines 18 to 20. Line 21 presents a compact alternative.
- The Paint.TextSize(text) property in line 27 returns the dimensions for a rectangle in which the text fits.
- In line 28, the x value is calculated so that the text is drawn centred in relation to the drawing area. You define the y value in a suitable way. When you click in the drawing area, the coordinates of the point you clicked on are always displayed. You should always leave this functionality switched on when testing a project for drawing with the Paint or Cairo classes.
- The length and height of the (text) rectangle are read out in lines 30 and 31 and assigned to the two variables W and H.
- A text shadow is drawn in line 33. You should definitely experiment with the two arguments Radius (→ 50) and Opacity (→ 0.8) and the shadow colour to achieve a good effect.
- Draw the (partial) text in lines 35 and 46.
You will certainly recognise that drawing text is possible and produces good results, but is very time-consuming. For this reason, the four lines 49 to 53 show you a quick alternative in RichText format that delivers similar results.
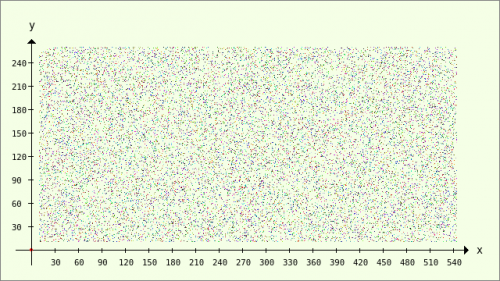
Example 2 - Drawing individual points
Figure 23.3.4.1.2: Pattern of random, coloured dots
There is no method in the Paint class for drawing a single point. With this approach, it works without any problems:
Public Sub SetPoint(X As Integer, Y As Integer, cColor As Integer)
  Paint.AntiAlias = False
    Paint.FillRect(X, Y, 1, 1, cColor)
  Paint.AntiAlias = True
End
But don't be disappointed if you find it difficult to make out the individual dot on the drawing area - it is so tiny. For this reason, the source code for a clearly visible point cloud is presented to you.
Source code:
[1] Public Sub PaintScriptPointCloud()
[2]   Dim i As Integer
[3]
[4]   GenerateNewPicture()
[5]   SetPictureBorder()
[6]   Paint.Begin(hPicture)
[7]     Paint.Translate(xTranslate, yTranslate)
[8]     Paint.Scale(xScale, yScale) '-- +y ▲
[9]     Paint.AntiAlias = False
[10]     DrawCoordinateSystem()
[11]     For i = 1 To 20000
[12]     '-- Points with random coordinates (in a fixed grid) and a random colour
[13]         SetPoint(Rnd(10, 550 - 5), Rnd(10, 260), Color.RGB(Rnd(0, 255), Rnd(0, 255), Rnd(0, 255)))
[14]     Next
[15]     Paint.AntiAlias = True
[16]   Paint.End()
[17]
[18] End
Comment:
- In line 10, the procedure DrawCoordinateSystem() is used to draw a complete coordinate system, for whose 11 (partial) drawings you can read the complete source code:
Public Sub DrawCoordinateSystem()
    Draw_X_Axis()
    Draw_X_AxisArrow()
    Draw_X_AxisScale()
    Draw_X_AxisLabels()
    Draw_X_AxisCaption()
      SetOrigin()
    Draw_Y_Axis()
    Draw_Y_AxisArrow()
    Draw_Y_AxisScale()
    Draw_Y_AxisLabels()
    Draw_Y_AxisCaption()
End

Private Sub Draw_X_Axis()
' x-Achse
  Paint.AntiAlias = False
    Paint.MoveTo(-20, 0)
    Paint.LineTo(560, 0)
    Paint.Stroke
  Paint.AntiAlias = True
End

Public Sub Draw_X_AxisArrow()
  Dim i As Integer = 1
' x-Achse-Pfeil
  Paint.AntiAlias = False
    For i = 1 To 5
      Paint.MoveTo(553 + i, 6 - i)
      Paint.LineTo(553 + i, -7 + i)
      Paint.Stroke
    Next
  Paint.AntiAlias = True
End

Public Sub Draw_X_AxisScale()
  Dim i As Integer = 1
' x-Skale
  Paint.AntiAlias = False
    For i = 1 To 18
      Paint.MoveTo(30 * i, 2)
      Paint.LineTo(30 * i, -4)
      Paint.Stroke
    Next
  Paint.AntiAlias = True
End

Public Sub Draw_X_AxisLabels()
  Dim i As Integer = 1
' Labelling x-axis
  Paint.Scale(1, -1) '-- +y ▼
    Paint.Font = Font["Monospace, 8"]
    Paint.Brush = Paint.Color(Color.Black)
    For i = 1 To 3 ' zweistellig
      Paint.DrawText(Str(30 * i), 25 + (i - 1) * 30, 20) '-- Iteration equation
    Next
    For i = 4 To 18 ' dreistellig
      Paint.DrawText(Str(30 * i), 22 + (i - 1) * 30, 20) '-- Iteration equation
    Next
  Paint.Scale(1, -1)
End

Public Sub Draw_X_AxisCaption()
  Paint.AntiAlias = False
    Paint.Scale(1, -1)
    Paint.Font = Font["Monospace, 10"]
    Paint.DrawText("x", 570, 5)
    Paint.Font = Font["Monospace, 8"]
    Paint.Scale(1, -1)
  Paint.AntiAlias = True
End

Public Sub Draw_Y_Axis()
'-- y-axis
  Paint.AntiAlias = False
    Paint.MoveTo(0, -20)
    Paint.LineTo(0, 270)
    Paint.MoveTo(0, 0)
    Paint.Stroke()
  Paint.AntiAlias = True
End

Public Sub Draw_Y_AxisArrow()
  Dim i As Integer = 1
'-- y-axis arrow
  Paint.AntiAlias = False
    For i = 1 To 5
      Paint.MoveTo(-6 + i, 264 + i)
      Paint.LineTo(7 - i, 264 + i)
      Paint.Stroke()
    Next
  Paint.AntiAlias = True
End

Public Sub Draw_Y_AxisScale()
  Dim i As Integer = 1
'-- y-scale
  Paint.AntiAlias = False
    For i = 1 To 8
      Paint.MoveTo(2, 30 * i)
      Paint.LineTo(-4, 30 * i)
      Paint.Stroke()
    Next
  Paint.AntiAlias = True
End

Public Sub Draw_Y_AxisLabels()
  Dim i As Integer = 1
'-- Labelling y-axis
  Paint.Scale(1, -1)
    For i = 1 To 8
      Paint.DrawText(Str(30 * i), -25, -25 - (i - 1) * 30)
    Next
  Paint.Scale(1, -1)
End

Public Sub Draw_Y_AxisCaption()
  Paint.Scale(1, -1)
    Paint.Font = Font["Monospace, 10"]
    Paint.DrawText("y", -3, -283)
    Paint.Font = Font["Monospace, 8"]
  Paint.Scale(1, -1)
End

Private Sub SetOrigin()
'-- Coordinate origin
  Paint.Brush = Paint.Color(Color.Red)
  Paint.MoveTo(0, 0)
  Paint.Arc(0, 0, 2)
  Paint.Fill()
  Paint.Brush = Paint.Color(Color.Black)
End
Comment:
- A special feature can be seen not only in the penultimate procedure Draw_Y_AxisCaption(): The coordinate system is scaled twice. The background is simple - but should always be kept in mind. For drawing, it is a good idea to move the coordinate system so that the labels of the coordinate axis are clearly legible and the y-axis is pointing upwards. However, if you now want to draw text, you will see it mirror-inverted. The first Paint.Scale(1, -1) therefore inverts the direction of the y-axis back downwards - only for drawing text - and the second Paint.Scale(1, -1) makes the positive y-axis point upwards again after the text has been drawn.
- You must also ensure that the y-coordinate for the text to be drawn is also inverted!
If you want to place clearly visible points on the drawing area, you have the option of drawing small coloured circles:
Paint.Brush = Paint.Color(Color.Blue)
  Paint.Arc(Mx, My, 3)
Paint.Fill()
Example 3 - Representation of a function
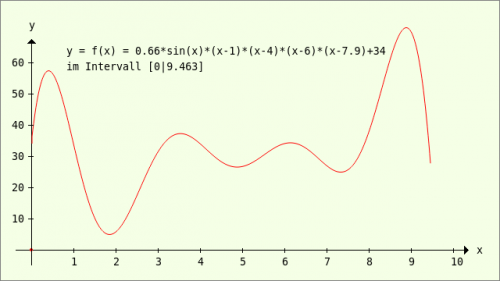
In this example, the representation of a function y = f(x) is largely static, as the function, the definition range and also the value range are fixed. A complete function plotter with extended functionality is only presented in section 23.3.5.7.
You will recognise in the source text that only some partial drawings of the coordinate system are used because the scale selected for the abscissa and ordinate requires a different scale division. All descriptions and the function name are only inserted after the function image has been drawn.
Figure 23.3.4.1.3: Image of the function f(x) in the specified interval
Source code:
Public Function f(x As Float) As Float
  Return 0.66 * Sin(x) * (x - 1) * (x - 4) * (x - 6) * (x - 7.9) + 34
End
Public Sub PaintScriptFunction()
  Dim X0, Y0, X1, Y1 As Float
  Dim i As Integer
  Dim sLabel As String

  GenerateNewPicture()
  SetPictureBorder()
  Paint.Begin(hPicture) '-- MOTTO: DRAW FIRST AND THEN LABEL!
'-- Shifting the coordinate system
    Paint.Translate(xTranslate, yTranslate)
'-- Scaling of the coordinate system
'-- Positive x-axis to the right - positive y-axis points upwards
    Paint.Scale(xScale, yScale) '-- +y ▲
    Paint.AntiAlias = False     '-- False is standard
    Paint.LineWidth = 1         '-- LineWidth = 1 is standard
    Paint.Brush = Paint.Color(Color.Black) '-- Character colour black is standard

    Draw_X_Axis()
    Draw_X_AxisArrow()
    Draw_X_AxisCaption()
      SetOrigin()
    Draw_Y_Axis()
    Draw_Y_AxisArrow()
    Draw_Y_AxisCaption()

    Paint.AntiAlias = True
    Paint.Brush = Paint.Color(Color.Red)

    X0 = 0
    Y0 = 4 * f(0) '-- Matching scale ' f(0) = 34
    Paint.MoveTo(X0 + 1, Y0)

    While i < 511
      Inc i
      X1 = i
      Y1 = 4 * f(i * (1 / 54)) '-- Control Arguments: Print i * (1 / 54)
      Paint.LineTo(X1, Y1)
    Wend
    Paint.Stroke()
    Paint.AntiAlias = False
'-- x-scale
    Paint.Brush = Paint.Color(Color.Black)

    For i = 1 To 10
      Paint.MoveTo(54 * i, 2)
      Paint.LineTo(54 * i, -4)
      Paint.Stroke
    Next
'-- y-scale
    For i = 1 To 6
      Paint.MoveTo(2, 40 * i)
      Paint.LineTo(-4, 40 * i)
      Paint.Stroke
    Next

'-- TEXT
    Paint.NewPath
    Paint.Scale(1, -1) '-- +y ▼
    Paint.Font = Font["Monospace, 10"]
    Paint.Brush = Paint.Color(Color.Black)
    Paint.DrawText("y = f(x) = 0.66*sin(x)*(x-1)*(x-4)*(x-6)*(x-7.9)+34", 45, -250)
    sLabel = ("in the interval")
    Paint.DrawText(sLabel & " [0|9.463]", 45, -230)

'-- Labelling x-axis
    For i = 1 To 10
      Paint.DrawText(Str(1 * i), 51 + (i - 1) * 54, 20)
    Next
'-- Labelling y-axis
    For i = 1 To 6
      Paint.DrawText(Str(10 * i), -25, -35 - (i - 1) * 40)
    Next
    Paint.Scale(1, -1) '-- +y ▲
Paint.End

End
Example 4 - Visualisation of data - pie chart
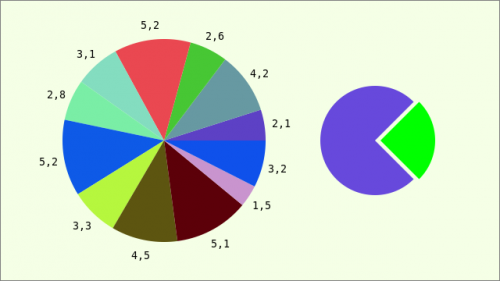
The Paint class shows its strengths when it comes to the graphical visualisation of data in a pie chart or bar chart, for example.
Figure 23.3.4.1.4: Pie chart
You can use the source code below to draw a pie chart with the value associated with each sector. Important passages in the source code are commented.
[1] Public Sub PaintScriptChart()
[2]   Dim i As Integer
[3]   Dim fStartAngle, fTotal, fPx, fPy, fRadius, fMx, fMy, fRadiusOffset As Float
[4]   Dim fSumme As Float = 0
[5]   Dim textDimension As RectF
[6]   Dim aData, aAngle As Float[]
[7]
[8]   fMx = 170
[9]   fMy = 140
[10]   fRadius = 130
[11]   fRadiusOffset = 20
[12]
[13] ' Inline array with the values to be displayed
[14]   aData = [2.1, 4.2, 2.6, 5.2, 3.1, 2.8, 5.2, 3.3, 4.5, 5.1, 1.5, 3.2]
[15]   For i = 0 To aData.Max
[16]       fTotal = fTotal + aData[i]
[17]   Next
[18] ' aAngle => Array for the data angle equivalents (radians)
[19]   aAngle = New Float[aData.Count]
[20]   For i = 0 To aData.Max
[21]       aAngle[i] = (aData[i] / fTotal) * Pi(2) '-- Conversion 'value' to its 'angle equivalent'
[22]   Next
[23]
[24]   GenerateNewPicture()
[25]   SetPictureBorder()
[26]   Paint.Begin(hPicture)
[27]     Paint.Translate(xTranslate, yTranslate)
[28]     Paint.Scale(xScale, yScale) '-- +y ▲
[29]
[30]     fStartAngle = 0
[31]   ' Draw circle sectors - Quantity: aData.Max
[32]     For i = 0 To aData.Max
[33]       Paint.Brush = Paint.Color(Color.RGB(Rnd(0, 255), Rnd(0, 255), Rnd(0, 255)))
[34]       Paint.Arc(fMx, fMy, fRadius, fStartAngle, aAngle[i], True) '-- Circle sector
[35]       Paint.Fill
[36]       fStartAngle = fStartAngle + aAngle[i] '-- New start angle
[37]     Next
[38]
[39] '-- Draw values to the associated sector - Quantity: aData.Max
[40]     For i = 0 To aData.Max
[41]       fStartAngle = fSumme + aAngle[i] / 2
[42]       fSumme = fSumme + aAngle[i]
[43]       fPx = (fRadius + fRadiusOffset) * Cos(fStartAngle) + fMx
[44]       fPy = (fRadius + fRadiusOffset) * Sin(fStartAngle) + fMy
[45]
[46]       textDimension = Paint.TextSize(aData[i])
[47]       fPx = fPx - (textDimension.Width / 2)
[48]       fPy = fPy - (textDimension.Height / 3)
[49]
[50]       Paint.Scale(1, -1) ' +y ▼
[51]         Paint.Brush = Paint.Color(Color.Black)
[52]         Paint.Font = Font["Monospace, 10"]
[53]         Paint.DrawText(Str(aData[i]), fPx, - fPy)
[54]       Paint.Scale(1, -1) ' +y ▲
[55]     Next
[56]
[57] '-- 2nd image with highlighted sector - addition
[58]     Paint.Brush = Paint.Color(Color.RGB(Rnd(0, 255), Rnd(0, 255), Rnd(0, 255)))
[59]     Paint.Arc(440, fMy, 70, Pi / 4, 3 * Pi / 2, True)
[60]     Paint.Fill
[61]     Paint.Brush = Paint.Color(Color.Green)
[62]     Paint.Arc(440 + 7, fmy, 70, - Pi(0.25), Rad(90), True)
[63]     Paint.Fill
[64]   Paint.End
[65]
[66] End
Comment:
- An array (inline array) in line 14 serves as the data source for the 12 values.
- The sum fTotal is calculated from all values in the array in lines 15 to 17.
- In lines 20 to 22, the angle equivalents associated with each value are calculated and stored in another array aAngle in radians.
- The drawing of the individual sectors with a randomly calculated colour value is implemented in lines 32 to 37, whereby the start angle is recalculated for each sector (line 36).
- The labelling of the individual sectors with the corresponding value in the extension of the angle bisector of each sector - the value of the variable fRadiusOffset is used for this - takes place in lines 40 to 55. Of interest here are not the instructions for drawing the value texts (line 53), but the calculations of the positions of the value texts. The positions fPx and fPy are calculated using the Paint.TextSize(text) property.
- For a large number of values, you may need to reduce the font size in the font considerably and increase the offset.
- The 2nd drawing only serves to illustrate how a dominant sector can be emphasised. However, this partial drawing is not related to the pie chart on the left.
Example 5 - Visualisation of data - bar chart
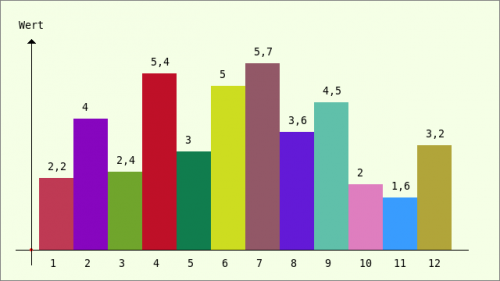
Figure 23.3.4.1.5: Bar chart
In the source code for the bar chart, the instruction in line 32 performs the main task - drawing the individual rectangles (bars) - whose height corresponds to their relative value.
[1] Public Sub PaintScriptBarChart()
[2] Dim i As Integer
[3]   Dim fDeltaX, fDeltaY, fBeginX, fEndX, fEndY, fMaxValue As Float
[4]   Dim aData, aDataC As Float[]
[5]   Dim sCaption As String
[6]
[7] ' Inline array with the values to be displayed
[8]   aData = [2.2, 4, 2.4, 5.4, 3, 5.0, 5.7, 3.6, 4.5, 2.0, 1.6, 3.2]
[9]   aDataC = aData.Copy()    '-- Copy of the array of original values
[10]   aDataC.Sort(gb.Descent) '-- Descending sorting of the elements
[11]   fMaxValue = aDatac[0]   '-- The 1st element is now the largest value in the array
[12]
[13]   fBeginX = 10 '-- Definition of the abscissa drawing area
[14]   fEndX = 540
[15]   fEndY = 240  '-- Definition of the drawing area Ordinate
[16]   fDeltaX = Round((fEndX - fBeginX) / aData.Count, 0) '-- Standardised strip width (unit)
[17]   fDeltaY = Round(fEndY / fMaxValue, 0)               '-- Standardised strip height (unit)
[18]
[19]   GenerateNewPicture()
[20]   SetPictureBorder()
[21]   Paint.Begin(hPicture)
[22]     Paint.Translate(xTranslate, yTranslate)
[23]     Paint.Scale(xScale, yScale) ' +y ▲
[24]
[25]     Draw_X_Axis()
[26]     SetOrigin()
[27]     Draw_Y_Axis()
[28]     Draw_Y_AxisArrow()
[29]
[30]     For i = 0 To aData.Max
[31] '-- Calculation and display of all rectangles in the diagram with random strip colour and value
[32]       Paint.FillRect(fBeginX + i * fDeltaX, 0, fDeltaX, fDeltaY * aData[i], Color.RGB(Rnd(0, 255), Rnd(0, 255), Rnd(0, 255)))
[33]       Paint.Scale(1, -1) ' +y ▼
[34]         Paint.Brush = Paint.Color(Color.Black)
[35]         Paint.Font = Font["Monospace, 10"]
[36]         Paint.DrawText(Str(aData[i]), fBeginX + 0.25*fDeltaX + i*fDeltaX, -(fDeltaY * aData[i] + 10))
[37]         Paint.Font = Font["Monospace, 10"]
[38]         Paint.DrawText(Str(i + 1), fBeginX + 0.33 * fDeltaX + i * fDeltaX, 22)
[39]       Paint.Scale(1, -1) '-- +y ▲
[40]     Next
[41]
[42] '-- Labelling the y-axis
[43]     Paint.Scale(1, -1) ' +y ▼
[44]       sCaption = ("Value")
[45]       If Paint.TextSize(sCaption).W / 2 > xTranslate Then
[46]          Paint.DrawText(sCaption, 0 - xTranslate / 2, -283)
[47]       Else
[48]          Paint.DrawText(sCaption, 0 - Paint.TextSize(sCaption).W / 2, -283)
[49]       Endif
[50]       Paint.Font = Font["Monospace, 8"]
[51]     Paint.Scale(1, -1) '-- +y ▲
[52]   Paint.End()
[53]
[54] End
Comment:
- An array (inline array) (line 8) also serves as the data source for the 12 values in this bar chart.
- In lines 9 to 11, the largest value in the array aData is determined via the array copy and assigned to the variable fMaxValue.
- The relative column heights are calculated from the individual values and the value of fMaxValue (line 16).
- In line 17, the column width is calculated from the specifications fBeginX and fEndX in lines 13 and 14.
- The individual columns are drawn with a randomly calculated colour value in lines 30 to 40. The value texts above the column and the column number are then drawn in.
- An identifier - here “Value” - is drawn in lines 42 to 52. There is a special solution for longer identifiers. The German version contains the character string “Wert”.
Example 6 - Fill pattern for areas
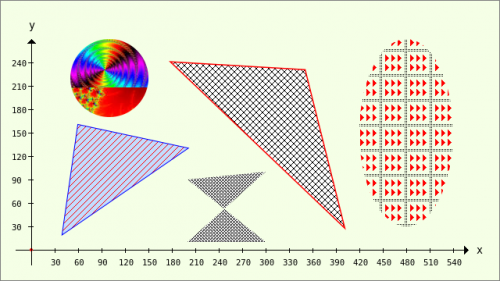
It increases the quality of drawn areas if you fill them with a single-colour or coloured pattern. In the example, some of the existing black and white patterns from the Draw class or patterns you have created yourself are used. In the source code, the patterns are read from individual image files. The corresponding lines are marked in colour.
Figure 23.3.4.1.6: Fill pattern for surfaces
[1] Public Sub PaintScriptPattern()
[2]   Dim hPattern As Image
[3]
[4]   GenerateNewPicture()
[5]   SetPictureBorder()
[6]   Paint.Begin(hPicture)
[7]     Paint.Translate(xTranslate, yTranslate)
[8]     Paint.Scale(xScale, yScale) '-- +y ▲
[9]
[10]     DrawCoordinateSystem()
[11]     Paint.AntiAlias = True
[12]     hPattern = Image.Load("Pattern/18.png")
[13]     Paint.Brush = Paint.Image(hPattern)
[14]     Paint.Arc(100, 220, 50)
[15]     Paint.Fill()
[16]
[17]     Paint.LineWidth = 2
[18]     Paint.Brush = Paint.Color(Color.Blue)
[19]     Paint.Polygon([40, 20, 60, 160, 200, 130]) '-- A(40|20), B(60|160) und C(200|130)
[20]     Paint.Stroke(True)
[21]     hPattern = Image.Load("Pattern/15.png")
[22]     Paint.Brush = Paint.Image(hPattern)
[23]     Paint.Fill()
[24]
[25]     Paint.LineWidth = 3
[26]     Paint.Brush = Paint.Color(Color.Red)
[27]     Paint.Polygon([180, 240, 400, 30, 350, 230])
[28]     Paint.Stroke(True)
[29]     hPattern = Image.Load("Pattern/14.png")
[30]     Paint.Brush = Paint.Image(hPattern)
[31]     Paint.Fill()
[32]
[33]     hPattern = Image.Load("Pattern/6.png")
[34]     Paint.Brush = Paint.Image(hPattern)
[35] '-- Points A(200|10), B(300|10), C(300|100), D(200|90)
[36]     Paint.Polygon([200, 10, 300, 100, 200, 90, 300, 10]) '-- Observe the order of the points ACDB!
[37]     Paint.Fill()
[38]
[39]     hPattern = Image.Load("Pattern/17.png")
[40]     Paint.Brush = Paint.Image(hPattern)
[41]     Paint.Ellipse(420, 30, 120, 240)
[42]     Paint.Fill()
[43]     Paint.AntiAlias = False
[44]   Paint.End
[45]
[46] End
Example 7 - Radial gradient
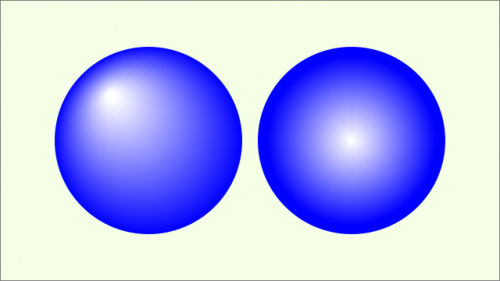
The effects that can be created with the Paint.RadialGradient method will also convince you:
[1] Public Sub PaintScriptRadialGradient()
[2]   Dim aColors As Integer[] = [Color.Blue, Color.White]
[3]   Dim aPositions As Float[] = [1, 0.05]
[4]   Dim aColors2 As Integer[] = [Color.Blue, Color.White]
[5]   Dim aPositions2 As Float[] = [0.9, 0.01]
[6]
[7]   GenerateNewPicture()
[8]   SetPictureBorder()
[9]   Paint.Begin(hPicture)
[10]     Paint.Translate(xTranslate, yTranslate)
[11]     Paint.Scale(xScale, yScale) '-- +y ▲
[12]
[13]     Paint.AntiAlias = True
[14]     Paint.Brush = Paint.RadialGradient(150, 140, 120, 100, 200, aColors, aPositions)
[15]     Paint.Arc(150, 140, 120)
[16]     Paint.Fill()
[17]
[18]     Paint.Brush = Paint.RadialGradient(410, 140, 120, 410, 140, aColors2, aPositions2)
[19]     Paint.Arc(410, 140, 120)
[20]     Paint.Fill()
[21]     Paint.AntiAlias = False
[22]   Paint.End
[23]
[24] End
Figure 23.3.4.1.7: Effects with RadialGradient
For the left-hand 'sphere', the fictitious lighting appears to come from the top left and for the right-hand one from the front - simply beautiful!
Example 8 - Linear gradient
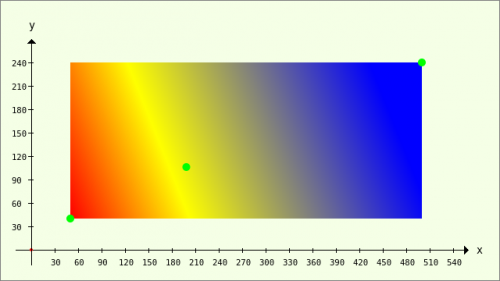
We are still looking for possible uses for the LinearGradient effects. What can you think of? These are the achievable results for a three-colour gradient. You can find the source code in the project and the necessary theory in → Chapter 23.3.2.
Figure 23.3.4.1.8: Effect with LinearGradient
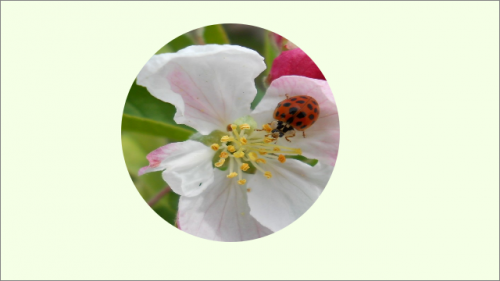
Example 9 - Image area - Clip
You need to know this: The defined clip region influences all further drawing operations and any image change outside this region is ignored.
Figure 23.3.4.1.9: Circular image area with background image
The scope of the source code for this effect is short:
[1] Public Sub PaintScriptImageClip()
[2]   Dim hImage As Image
[3]   Dim fMx, fMy, fRadius As Float
[4]
[5]   GenerateNewPicture()
[6]   SetPictureBorder()
[7]   Paint.Begin(hPicture)
[8]     Paint.Translate(xTranslate, yTranslate)
[9]     Paint.Scale(xScale, yScale) '-- +y ▲
[10]
[11]     fMx = 255
[12]     fMy = 150
[13]     fRadius = 140
[14]     Paint.AntiAlias = True
[15]     Paint.Arc(fMx, fMy, fRadius)
[16]     Paint.Clip '-- Defining the current drawing area
[17]     hImage = Image.Load("ladybird_1.png")
[18]     hImage = hImage.Rotate(Pi)
[19] '-- hImage = hImage.Stretch(fMx + fRadius, fMy + fRadius) '-- Alternative with 2 lines
[20] '-- Paint.DrawImage(himage, fMx - fRadius, fMy - fRadius)
[21] '-- One-liner with stretch function included!
[22]     Paint.DrawImage(hImage, fMx - fRadius, fMy - fRadius, fMx + fRadius, fMy + fRadius)
[23]     Paint.AntiAlias = False
[24]   Paint.End()
[25]
[26] End
Comment:
- A circle is defined as the shape for the image area in line 15.
- Exactly this circle becomes the active image area (line 16).
- Whether you use the two lines 19 and 20 or just line 22 is up to you. The effect achieved is adequate - the loaded image is placed behind the circular image area in such a way that there is no overlapping gap.

