Sidebar
k23:k23.8:k23.8.1:start
23.8.1 Line chart project
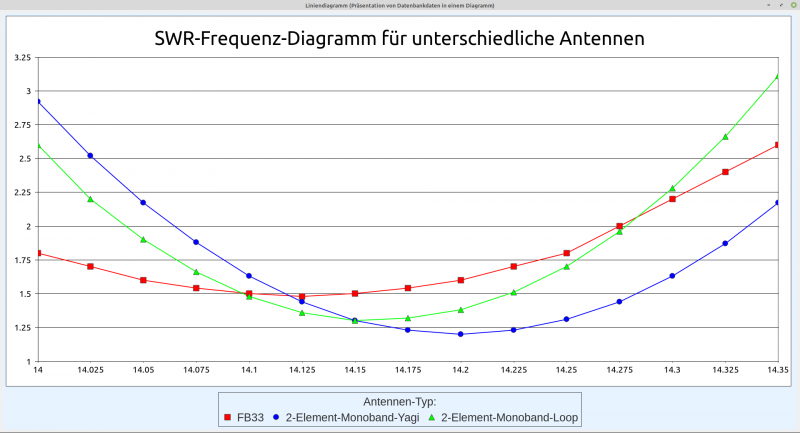
The following project shows you how to use classes of the chart component gb.chart to create a line symbol chart → Figure 23.8.1.1 SWR line chart:
Figure 23.8.1.1: SWR line-symbol diagram
This is the complete, sufficiently commented source code:
' Gambas class file

Public hChart As New Chart

Public Sub Form_Open()

    FChart.Resizable = True

'-- Creates a diagram with the given properties and data.
    CreateChart()

End

Public Sub CreateChart()

    SetChartGeneral()
    SetChartType()
    SetChartColors()
    SetChartLegend()
    SetChartXAxis()
    SetChartYAxis()
    SetChartValues()

End

Public Sub DrawingArea1_Draw()

'-- Sets the height and width of the diagram.
    hChart.Width = DrawingArea1.ClientWidth
    hChart.Height = DrawingArea1.ClientHeight

'-- The chart object can be rendered on a form in a DrawingArea.
    hChart.Draw()

End

Public Sub Form_Close()

    FChart.Close()

End

'-- Private Procedure ------------------------------------------------------------------

Private Sub SetChartGeneral()

'-- Sets the color for the background of the diagram
    hChart.BackGround = Color.White ' &HC3DDFF

'-- Sets a border around the diagram
    hChart.Border = True

'-- Sets the diagram description (titel)
    hChart.Title.Visible = True
    hChart.Title.Text = ("SWR frequency diagrams for different antennas")
    hChart.Title.Font = Font["NotoSans,24"] ' Font for the title - absolute in px

'-- Sets the diagram style
    hChart.Style = ChartStyle.Default
    hChart.Proportionnal = True

End

Private Sub SetChartColors()

'-- Sets the user-defined colors
    hChart.Colors.Style = Chart.Colors.Custom
    hChart.Colors.Values = [Color.Red, Color.Blue, Color.Green]

'-- Alternative: Sets the colors automatically
'   Chart.Colors.Style = Chart.Colors.Auto

End

Private Sub SetChartType()

'-- Sets the diagram type
    hChart.Type = ChartType.LinesSymbols

End

Private Sub SetChartValues()

    Dim hDBResult As Result
    Dim i As Integer

'-- Sets the number of data series.
    hChart.CountDataSets = 3

'-- Returns the result of a database query as a database result
    hDBResult = DBCS.DBConnection.Exec("SELECT frequenz, fb3320, yagi20, loop20 FROM " & "testseries1")

'-- Sets the values on the X-axis as a character string for each data series!
    For i = 1 To hDBResult.Count

      hDBResult.MoveTo(i - 1)

  '-- Sets the x-values in a string array
      hChart.Headers.Values.Add(CStr(hDBResult!frequenz))

  '-- Sets the y-values as float values
      hChart[0].Values.Add(hDBResult!fb3320)
  '-- Text to display in the legend
      hChart[0].Text = "FB33"

      hChart[1].Values.Add(hDBResult!yagi20)
  '-- Text to display in the legend
      hChart[1].Text = "2-Element-Monoband-Yagi"

      hChart[2].Values.Add(hDBResult!loop20)
  '-- Text to display in the legend
      hChart[2].Text = "2-Element-Monoband-Loop"
    Next

End

Private Sub SetChartLegend()

    hChart.Legend.Visible = True
    hChart.Legend.Position = Align.Bottom 	' Position either .Bottom or .Right
    hChart.Legend.Font = Font["NotoSans,14"] 	' Font for the title - absolute in px
    hChart.Legend.Title = ("Antenna type:")

End

Private Sub SetChartXAxis()

'-- X-Axis
    hChart.XAxe.Visible = True
    hChart.XAxe.MinValue = 14.00
    hChart.XAxe.MaxValue = 14.40
    hChart.XAxe.Step = 0.25

End

Private Sub SetChartYAxis(Optional argAuto As String)

'-- Y-Axis
    hChart.YAxe.Visible = True
    hChart.YAxe.ShowIntervalLines = True

    If argAuto And If Lower(argAuto) = "auto" Then
       hChart.XAxe.AutoScale = True
    Else
       hChart.YAxe.MinValue = 1
       hChart.YAxe.MaxValue = 3.25
       hChart.YAxe.Step = 0.25
    Endif

End
Notes:
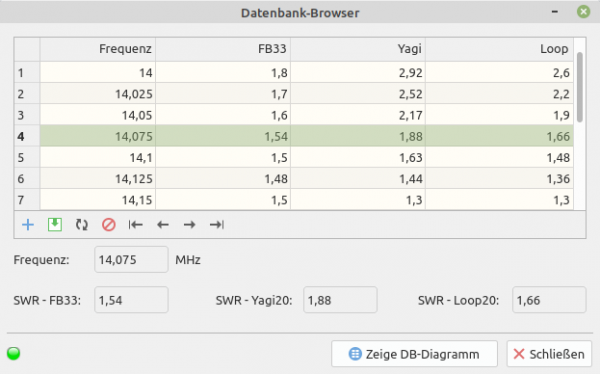
The gb.chart component must be integrated into the project and the data to be displayed comes from an SQLite database table. The database is included in the project:
Figure 23.8.1.2: Database table (frequency and SWR)
There is no option in the gb.chart component to
- to additionally draw the direction arrows of the coordinate axes,
- to insert the identifier of the x-axis (abscissa) or
- insert the identifier of the y-axis (ordinate).
Download
The website uses a temporary session cookie. This technically necessary cookie is deleted when the browser is closed. You can find information on cookies in our privacy policy.
k23/k23.8/k23.8.1/start.txt · Last modified: 09.03.2024 by emma
Page Tools
Except where otherwise noted, content on this wiki is licensed under the following license: CC Attribution-Noncommercial 3.0 Unported


