Sidebar
Table of Contents
11.5.0.3 Error Handling 4
This chapter focuses on debugging in the IDE, profiling, logging and the description of the System.BreakOnError property.
11.5.0.3.1 Debugging in Gambas
If you want to test a module or class and the procedures it contains in your Gambas project, the IDE provides you with appropriate tools. As a developer, you need for effective work:
- the algorithm used for the procedure to be tested,
- a suitable data-variable concept,
- an error management that you implement with Try, Catch, Finally, the event Application_Error(), the Boolean variable Error, the class Error and the statements Print, Debug and Error in the source code.
- Suitable data for testing.
This following procedure has proven to be effective:
- First decide what you are interested in programme output or current values of control elements:
Button 'Console'.
In the console of the IDE, all output of the statements Print, Debug, Error and general (system) error messages are printed such as these for example:
gb.gui.qt: warning: 'gb.qt5' component not found, using 'gb.qt4' instead
"sni-qt/13396" WARN  17:23:08.002 void StatusNotifierItemFactory::connectToSnw() Invalid interface to ...
Button 'debug' for programme runtime
- 'Current object' list. It contains controls and values of global variables marked in bold.
- 'Local variables' list. The list can also be empty, as the outputs depend on the local variables declared in the current procedure.
You must expand the lists if necessary.
- Set breakpoints in the source code with the function key F9 if necessary. A breakpoint can also be deleted again with F9.
- Start the programme in single-step mode with F8.
- Switch between F8 and the actions in a window with keyboard and mouse to run the programme in single step.
- Set whether you want to monitor an expression: Select the expression in the source text and then select 'Monitor expression' from the context menu with the right mouse button. The 'Monitor expressions' list is newly created or extended.
- Look at the possibly changed values in the lists 'Current object' and 'Local variables'. For simple data types, you can see the value directly in the 'Troubleshooting' window. For complex data types such as an array or a control element - recognisable by the round brackets - you can reach the first level of the relevant values with a double click. Here you can see the values of the simple data types and get to the next level for complex data types again with a double click.
Figure 11.5.0.3.1: 'Troubleshooting' window
Depending on the results, you will change the source code and test it again, thus gradually coming closer to the goal of developing a correctly working programme. Admittedly, the following example is contrived - but it shows the working method to track down a displayed error. This is the source code section:
Public Sub Form_Open()
  Dim x,y As Integer
  Dim a As Float
  Do
    x = Rnd(-3,3)
    y = Rnd(-3,3)
    a = 1/x + 2/y
  Loop
End
At some point this error shows up:
Figure 11.5.0.3.2: Error
Now the task is to explore what caused the error - x or y? Double click on the x in the erroneous line or mark x - then `2` will be displayed:
Figure 11.5.0.3.3: Value of x
X was therefore not. Double-click on y to show:
Figure 11.5.0.3.4: Error detected …
The second quotient 2/y is not defined: Division by zero!
11.5.0.3.2 Logging
Chapter 19.5 Logging describes the gb.logging component, which implements a flexible system for logging in Gambas applications. This component provides its functionality through the two classes Formatter and Logger. The class Formatter offers a good possibility for efficient debugging in the test phase of a programme. The complete log functionality is achieved by using the Logger class (Logger object).
11.5.0.3.3 Profiling
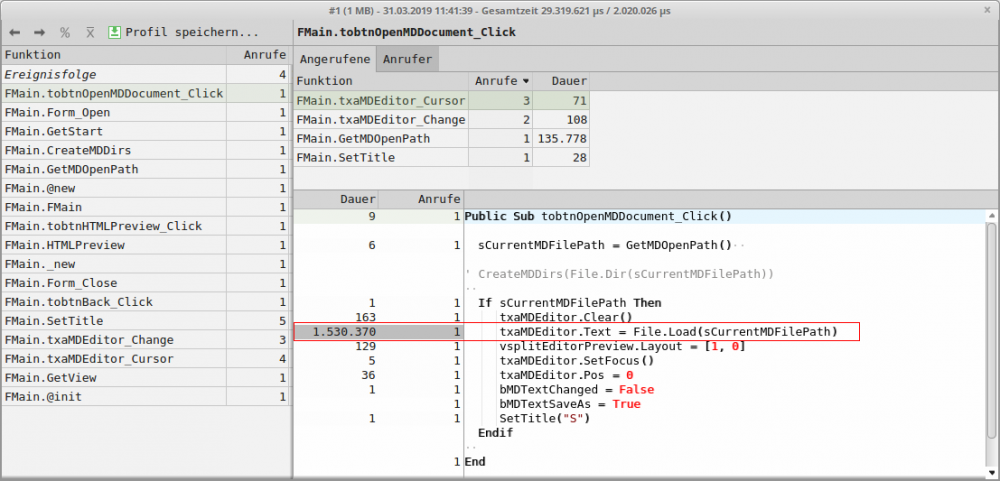
In Gambas, profiling is a form of dynamic program analysis that measures memory, time complexity, use of specific instructions, or frequency and duration of function calls.
Figure 11.5.0.3.5: Results when profiling is enabled.
The information displayed is used to support debugging in time-critical environments and programme optimisation.
You can switch on the profiling mode in the IDE in the menu 'Debugging> Enable Profiling'. In the source code, you can use the boolean variable System.Profile to query whether profiling mode is switched on or not. The static Boolean property System.Profile (gb) returns the value True if profiling is enabled. You can also set the property.
With `System.Profile = True` and `System.Profile = False` you can switch profiling on and off. This may be necessary if you only want to monitor a certain section of source code. Also, profiling can be slow and there is a limit to the size of the profile file. The default size is 512 MiB. Set the environment variable `GB_PROFILE_MAX` to a positive integer (unit in 'MiB'), then you can set the size from 128 MiB to 4 GiB. Note: If the programme is not run in the IDE with profiling mode enabled, the System.Profile property will be ignored.
11.5.0.3.4 System.BreakOnError
Gambas provides a very specific property, System.BreakOnError. This property allows the implementation of the Break on error feature in the IDE. The static property System.BreakOnError specifies whether a programme stops in the IDE when an error is raised - even if the error is properly caught in the programme. The property can also be set. If you set this property to True, then you can no longer catch errors. Any error will immediately abort the programme - regardless of whether you catch the error with Try or Catch or not.


