Sidebar
Table of Contents
24.9.0.2 D-Bus Introspection
The ability of a program to examine the properties of an exported D-Bus object at runtime is called introspection. With the component gb.dbus, Gambas has the ability to analyse a service, its objects, interfaces and their methods and properties, but also declared signals on the D-Bus, and to map them in a suitable form.
If you want to use inter-process communication (IPC) via the D-Bus in your Gambas programs, it is good to know:
- which applications are currently registered on the system D-bus and on the session D-bus, because not every program is dbus-enabled and can connect to the D-bus,
- which addresses are used for these applications. This ensures knowledge of the D-Bus name and object path and optionally to the interfaces (methods, properties and events) if these interfaces are declared,
- whether a description of the interfaces exists in an XML document with a special doctype declaration and if so, what the content of this document is.
24.9.0.2.1 Introspection Console
For example, the standard org.freedesktop.DBus.Introspectable interface has a method called Introspect() that allows you to read an existing interface description into an XML document. For the d-bus-enabled Network Manager, for example, call these two commands:
$ dbus-send --system --type=method_call --print-reply --dest=org.freedesktop.NetworkManager \
 /org/freedesktop/NetworkManager  org.freedesktop.DBus.Introspectable.Introspect > nwm.xml
$ xed $HOME/nwm.xml
This is the highly abbreviated content of the D-bus interface description of the Network Manager:
method return sender=:1.5 -> dest=:1.71 reply_serial=2
   string "<!DOCTYPE node PUBLIC "-//freedesktop//DTD D-BUS Object Introspection 1.0//EN"
"http://www.freedesktop.org/standards/dbus/1.0/introspect.dtd">
<node>
  <interface name="org.freedesktop.DBus.Introspectable">
    <method name="Introspect">
      <arg name="data" direction="out" type="s"/>
    </method>
  </interface>
  <interface name="org.freedesktop.DBus.Properties">
    <method name="Get">
      <arg name="interface" direction="in" type="s"/>
      <arg name="propname" direction="in" type="s"/>
      <arg name="value" direction="out" type="v"/>
    </method>
...
    <method name="GetAll">
      <arg name="interface" direction="in" type="s"/>
      <arg name="props" direction="out" type="a{sv}"/> ' type steht für Datentyp
    </method>
  </interface>
...
  <node name="DHCP4Config"/>
  <node name="IP6Config"/>
  <node name="Settings"/>

</node>
The next four sections present further use cases for the console programmes dbus-send, qdbus and dbus-monitor:
$ qdbus --help
Usage: qdbus [--system | --address ADDRESS] [--literal] [servicename] [path] [method] [args]
(1)Output the list of all D-Bus names of applications (services) on the system bus:
$ qdbus --system | grep -v ':'
...
 org.freedesktop.ConsoleKit
...
 org.freedesktop.NetworkManager
 org.freedesktop.PolicyKit1
 org.freedesktop.DBus
Alternatively, you can also work with the programme dbus-send:
SYNTAX: $ dbus-send --session --print-reply –dest=DienstName /Objekt-Pfad Schnittstelle
$ dbus-send --session --print-reply --dest=org.freedesktop.DBus /org/freedesktop/DBus \
  org.freedesktop.DBus.ListActivatableNames
(2)To get the list of all interfaces to a selected service from (1):
$ qdbus --system org.freedesktop.NetworkManager
...
/org/freedesktop/NetworkManager
/org/freedesktop/NetworkManager/ActiveConnection
...
/org/freedesktop/NetworkManager/IP6Config/0
/org/freedesktop/NetworkManager/Settings/0
(3)To get the list of all methods, properties and signals for a selected interface from (2):
$ qdbus --system org.freedesktop.NetworkManager /org/freedesktop/NetworkManager

method QString org.freedesktop.DBus.Introspectable.Introspect()
method QDBusVariant org.freedesktop.DBus.Properties.Get(QString interface, QString propname)
...
property read bool org.freedesktop.NetworkManager.NetworkingEnabled
property read QString org.freedesktop.NetworkManager.Version
…

signal void org.freedesktop.NetworkManager.DeviceAdded(QDBusObjectPath)
signal void org.freedesktop.NetworkManager.DeviceRemoved(QDBusObjectPath)
…

method uint org.freedesktop.NetworkManager.state()
Alternatively, you can also work here with the programme dbus-send:
$ dbus-send --system --print-reply --dest=org.freedesktop.NetworkManager /org/freedesktop/NetworkManager org.freedesktop.DBus.Introspectable.Introspect
(4)This way you can read out selected network properties for the network manager, for example. However, this requires that you already know exactly the names of the properties determined in point (3):
$ qdbus --system org.freedesktop.NetworkManager /org/freedesktop/NetworkManager org.freedesktop.NetworkManager.Version
0.9.8.8
$ qdbus --system org.freedesktop.NetworkManager /org/freedesktop/NetworkManager org.freedesktop.NetworkManager.NetworkingEnabled
true
It is much easier to obtain information about the applications logged on to the D-bus than in the console, either with the Gambas program DBusExplorer by Benoît Minisini and Fabien Bodard or the console program d-feet.
24.9.0.2.2 Program DBus-Explorer
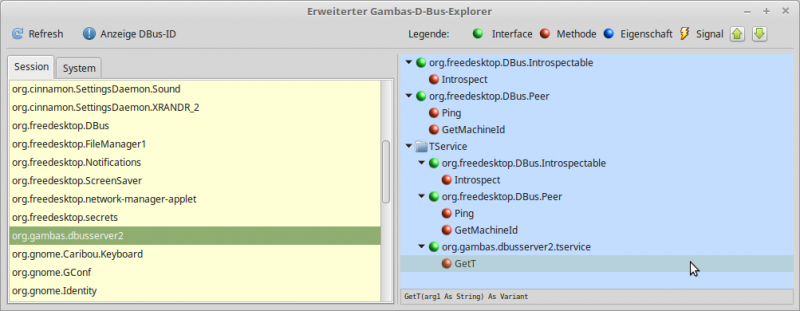
How to work successfully with the Gambas programme DBusExplorer:
- First select the desired bus (session bus or system bus).
- Then double-click on the selected service to read the XML document and display the interface description in full after you have expanded all entries.
- The legend informs you about the meaning of the individual colours.
- For example, the green arrow-down button displays all entries expanded.
- The green arrow-up button, on the other hand, collapses all entries except the first identifier.
- In the status bar, you can see the data type of the arguments returned by a selected method or signal.
The project by Fabien Bodard and Benoît Minisini was adapted by the author in such a way that, among other things, interfaces are now also colour-coded in the GUI:

Figure 24.9.0.2.1: DBusExplorer
The extended project DBus-Explorer can be found in the download area.
24.9.0.2.3 Program d-feet
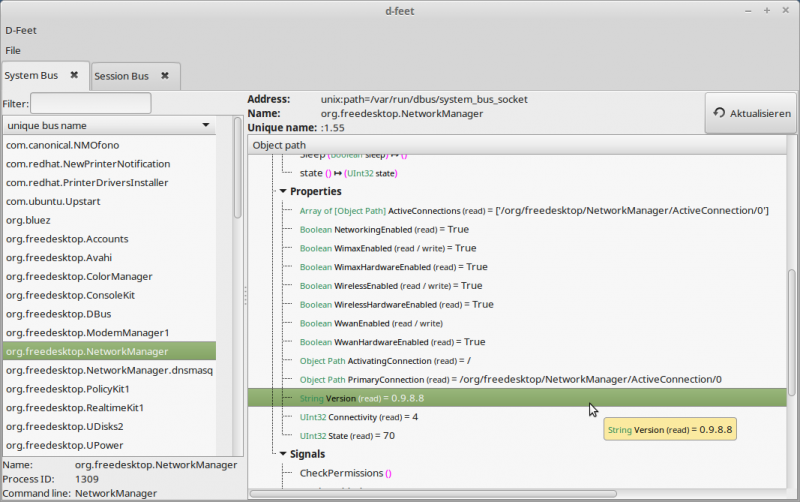
A programme with similar functionality is d-feet, which also goes on interface tracing for the D-Bus. This programme is the author's favourite. The special feature of this programme is that after a double-click on a property (Figure 24.9.0.2.2) its current value is displayed behind the property. With the methods, on the other hand, a dialogue opens in which suitable arguments can be entered for the parameters with which the selected method can subsequently be called. However, you should only do this if you know very well what the method does!

Figure 24.9.0.2.2: Programme d-feet
The author primarily uses the two programmes d-feet and dbus-monitor for an introspection. For the programme d-feet the following can be recommended:
- Start programme d-feet
- Select D-Bus suitable - here Session
- Select D-Bus application - org.gtk.Private.UDisks2VolumeMonitor
- Select D-Bus object - /org/gtk/Private/RemoteVolumeMonitor
- Unfold interfaces (1st entry: org.freedesktop.DBus.Introspectable)
- Unfold Methods (Entry: Introspect() → String xml_data)
- Double-click on the Introspect() method.
- Maximise the opening window
- Execute the inspection with 'Execute' and read the XML document.
With the correct addresses and an interface description for a particular d-bus-enabled application, you can, for example, read its properties or remotely control the application via method calls. For example, with the following command (method Stop; without argument) you shut down your computer via the D-bus (!):
$ dbus-send --system --print-reply --dest=org.freedesktop.ConsoleKit /org/freedesktop/ConsoleKit/Manager \
  org.freedesktop.ConsoleKit.Manager.Stop
This tells you the host name for the system:
$ qdbus --system org.freedesktop.NetworkManager \
  /org/freedesktop/NetworkManager/Settings \
  org.freedesktop.NetworkManager.Settings.Hostname
linux
24.9.0.2.4 Program DBusView
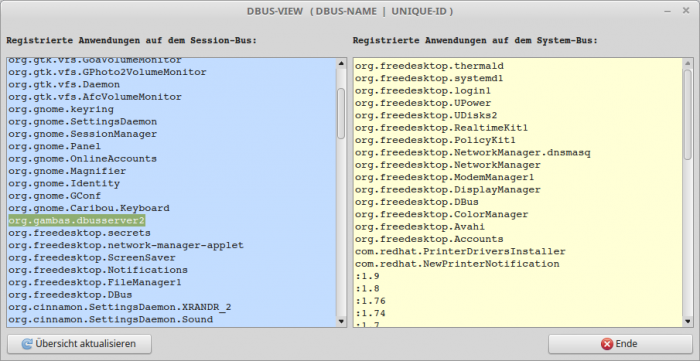
An overview of all programmes registered on the D-bus is also generated by the Gambas programme DBusView, which is introduced in chapter 24.9.2.1:

Figure 24.9.0.2.3: Registered applications on the Session D-Bus and on the System D-Bus
24.9.0.2.5 Monitoring D-Bus
After starting, the diagnostic programme dbus-monitor outputs all messages sent by the applications registered on the bus. However, they are so numerous that you should use suitable filters for the output if, for example, you are only interested in the message type:
$ dbus-monitor
Example with a simple filter:
$ dbus-monitor | grep 'type'
   string "eavesdrop=true,type='method_call'"
   string "eavesdrop=true,type='method_return'"
   string "eavesdrop=true,type='error'"
...
Things get really interesting when you look, for example, at the signals sent by the org.gtk.vfs.UDisks2VolumeMonitor application with the object path /org/gtk/Private/RemoteVolumeMonitor when a USB stick is inserted. For example, you can obtain this information for the signal with the signal name “VolumeAdded” (the signal name is also called member), from which you can also read the signatures of the arguments of the signal:
$ dbus-monitor
…
signal time=1523464912.402058 sender=:1.28 -> destination=(null destination) serial=60 path=/org/gtk/Private/RemoteVolumeMonitor; interface=org.gtk.Private.RemoteVolumeMonitor; member=VolumeAdded
   string "org.gtk.vfs.UDisks2VolumeMonitor"
   string "0xe01330"
   struct {
      string "0xe01330"
      string "2_GB_P"
      string ". GThemedIcon drive-removable-media-usb drive-removable-media drive-removable drive"
      string ". GThemedIcon drive-removable-media-usb-symbolic … drive-removable drive"
      string ""
      string ""
      boolean true
      boolean true
      string "0xe23480"
      string ""
      array [
         dict entry(
            string "class"
            string "device"
         )
         dict entry(
            string "unix-device"
            string "/dev/sdd1"
         )
         dict entry(
            string "label"
            string "2_GB_P"
         )
         dict entry(
            string "uuid"
            string "38ea6e0b-a161-401d-a673-11c06cf1229e"
         )
      ]
      string "gvfs.time_detected_usec.1523464912399238"
      array [
      ]
   }
You can read basic information on the subject of D-Bus signatures in the following chapter.
24.9.0.2.6 Gambas programme: Introspection
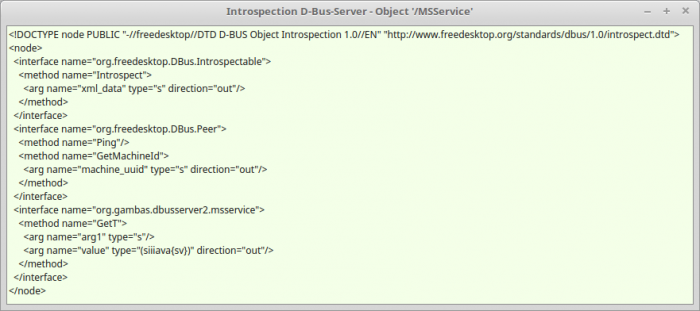
If you need the results of a D-Bus introspection in a Gambas program, you need the D-Bus name of the application to be inspected and the D-Bus object path. With this source code (FIntrospection.class) the intospection on the session D-bus succeeds:
' Gambas class file

Public Sub Form_Open()
  FIntrospection.X = 150 ' possibly adapt
  FIntrospection.Y = 200
  FIntrospection.Caption = "Introspection D-Bus-Server - Object '/MSService'"
  txaIntrospection.ReadOnly = True
End

Public Sub Form_Show()

  Dim sDBusApplicationName, sDBusObjectPath, sXMLText As String

  sDBusApplicationName = "session://" & "org.gambas.dbusserver2"
  sDBusObjectPath = "/MSService"
  Try sXMLText = DBus[sDBusApplicationName]._Introspect(sDBusObjectPath)
  txaIntrospection.Insert(RTrim(sXMLText))
  txaIntrospection.Pos = txaIntrospection.Length
End

Public Sub Form_KeyPress()
  If Key.Code = Key.ESC And FIntrospection.Closed = False Then FIntrospection.Delete()
  Endif
End
Im Hauptprogramm könnten Sie das Fenster mit dem Ergebnis der D-Bus-Introspection anzeigen:

Public Sub btnIntrospection_Click()
  FIntrospection.Show()
End


