Table of Contents
23.8.3 Circle diagram project
Some of the classes for creating pie charts differ fundamentally from the classes used in the previous chapter. One of the reasons for this is that the developer Fabien Bodard has redesigned the style classes so that the style instructions are read from a CSS file. The gb.report2 component also uses this type of style definition consistently.
23.8.3.1 Pie chart
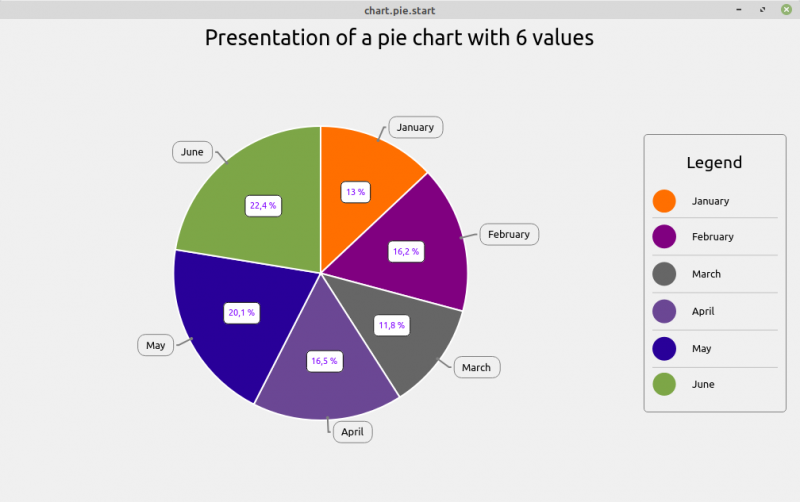
The data in the following table should be displayed in a pie chart, whereby the 6 values should be displayed as a percentage:
| Time/Month | January | February | March | April | May | June |
|---|---|---|---|---|---|---|
| Value | 3.3 | 4.11 | 3.0 | 4.2 | 5.1 | 5.7 |
Table 23.8.3.1.1: Time-value table
Figure 23.8.3.1.1: Circular diagram
This is the complete, sufficiently commented source code for a pie chart with 6 values:
' Gambas class file

Private hChart As New Chart
Private aData As Float[]
Private Enum Left, Right, Top, Bottom ' 0=Left, 1=Right, 2=Top, 3=Bottom

Public Sub Form_Open()

    FPieChart.Center()

'-- Setting the 6 chart values in a float array
    aData = [3.3, 4.11, 3.0, 4.2, 5.1, 5.7]
    hChart.Datas = [ChartDatas(aData)]

'-- Definition of the colors for the circle sectors - the default colors are overwritten
    hChart.Colors = [&Hff6f00, &H800080, &H666666, &H6B4794, &H290099, &H7da647]

    hChart.Title = "Presentation of a pie chart with 6 values"
    hChart.ShowTitle = True

'-- Setting the identifiers for the circle sectors and for the legend
    hChart.Labels = ["January", "February", "March", "April", "May", "June"]

'-- Display of the identifiers for the circle sectors
    hChart.Type.ShowLabel = True

'-- Show chart values
    hChart.Type.ShowValues = True
    hChart.Type.Percentage = True

'-- Chart legend
    hChart.LegendTitle = "Legend"
'-- See definition 'Enumeration'
    hChart.LegendeSide = Right
    hChart.ShowLegend = True

    DrawingArea1.Refresh()

End

Public Sub DrawingArea1_Draw()

    hChart.Paint(RectF(0, 0, Paint.W, Paint.H))

End
Notes:
- You can freely define the colours of the individual sectors. Otherwise the standard colours are used.
- It makes sense if you also display the values that represent the individual sectors. You can also display the values as a relative percentage in the individual sectors - which corresponds to the standard.
- The position at which the legend is displayed is defined directly by specifying the position. This is possible because the enumeration (enum) was defined appropriately in line 5.
